
Meet Maxene Graze
Meet Maxene Graze! Maxene is a Data Visualization Engineer and Researcher with a background in biological and linguistic research. Maxene explores innovative methods in data design, including multisensory representations that combine visual, auditory, and haptic stimuli to enhance understanding and engagement with data. We asked her a few questions in the lead up to her online course, Fermenting Data.
Hi Maxene! Super excited about your upcoming online course, Fermenting Data: Kimchi Dataset edition. Before we get into the course itself, can you say a little about your background? How did you first become interested in working with data and visualization?
My early work was in academic research (biology and language documentation), where I collected data on spider morphology and later on undocumented minority languages. It was rigorous and intellectually gratifying… but I kept getting stuck on the same question: who is this for? Who sees it, understands it, and benefits from it? I wanted my work to land faster and hit the community it was intended for.
When I discovered Georgia Lupi and her Data Humanism manifesto, it was one of those “light bulb moments, and I wanted to bring data humanism to create data stories that have an impact.
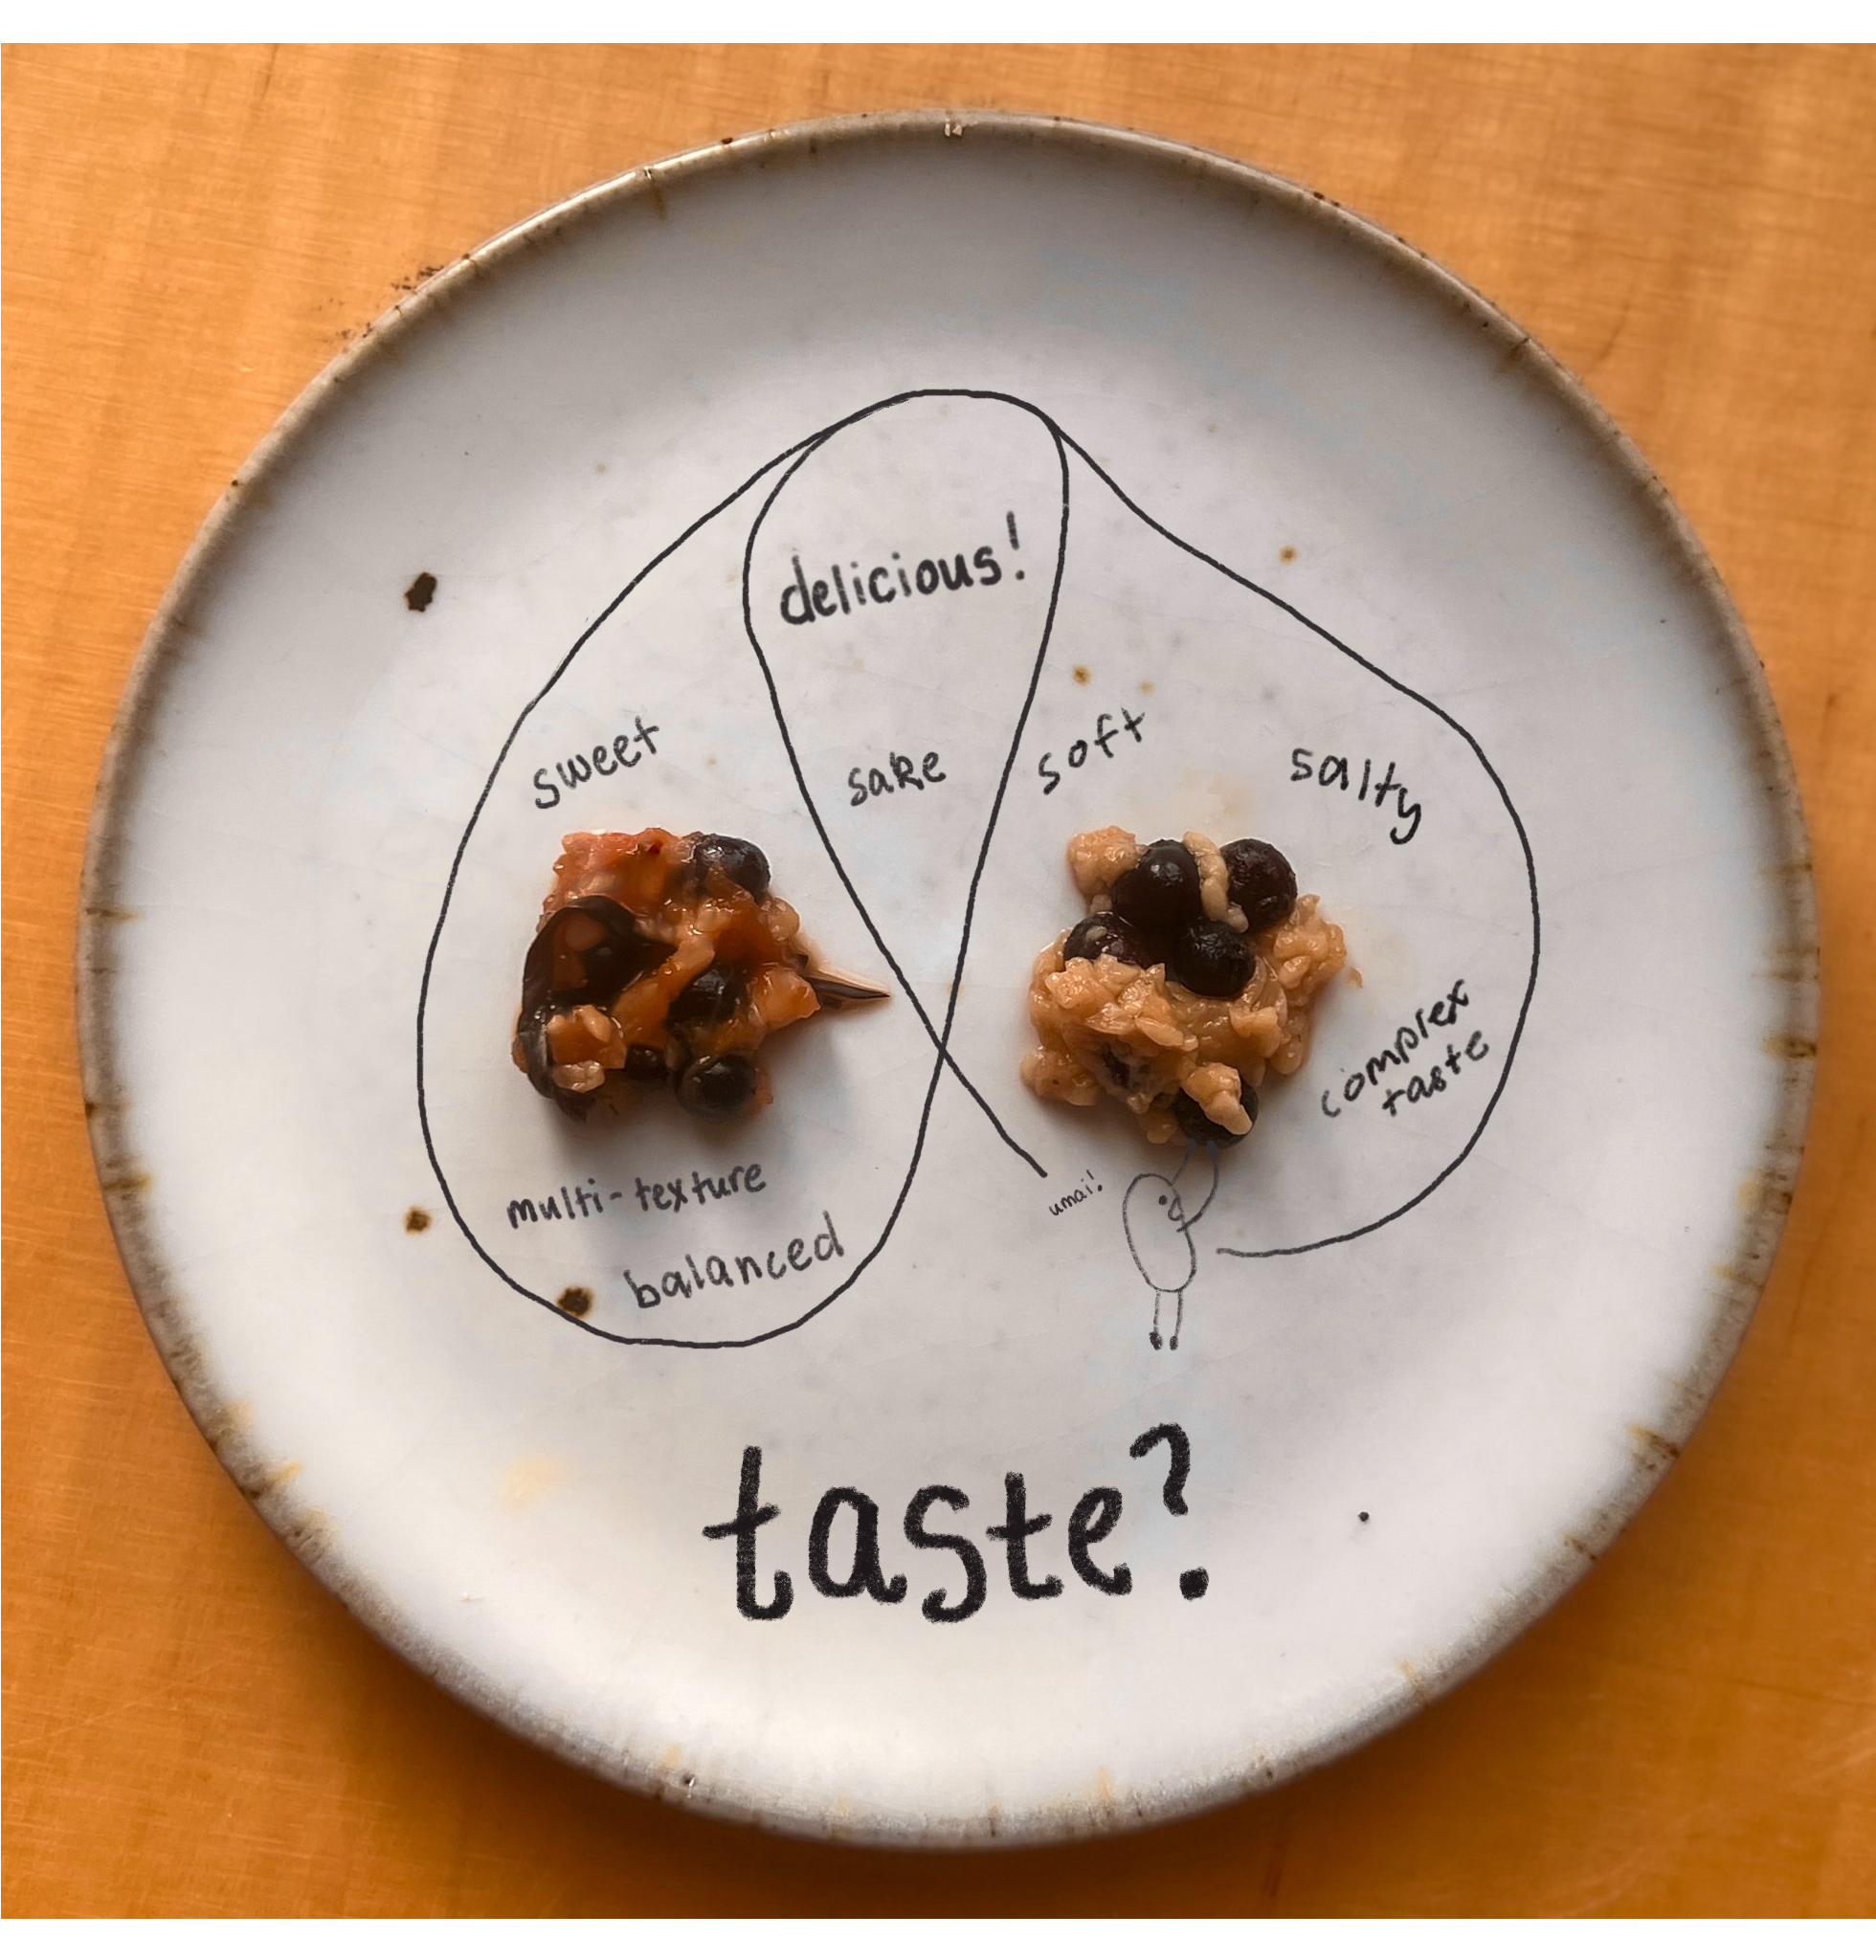
So I took the research foundation and built the design and technical skills on top of it. I started combining data visualization with the things I already cared about: language learning, reading, fermentation. But I still wanted data to be more intuitive and more embodied. So I started experimenting with encoding data through the senses, using the tools I was already drawn to: sound (because it’s shareable digitally), and pottery (because I love pottery and food).
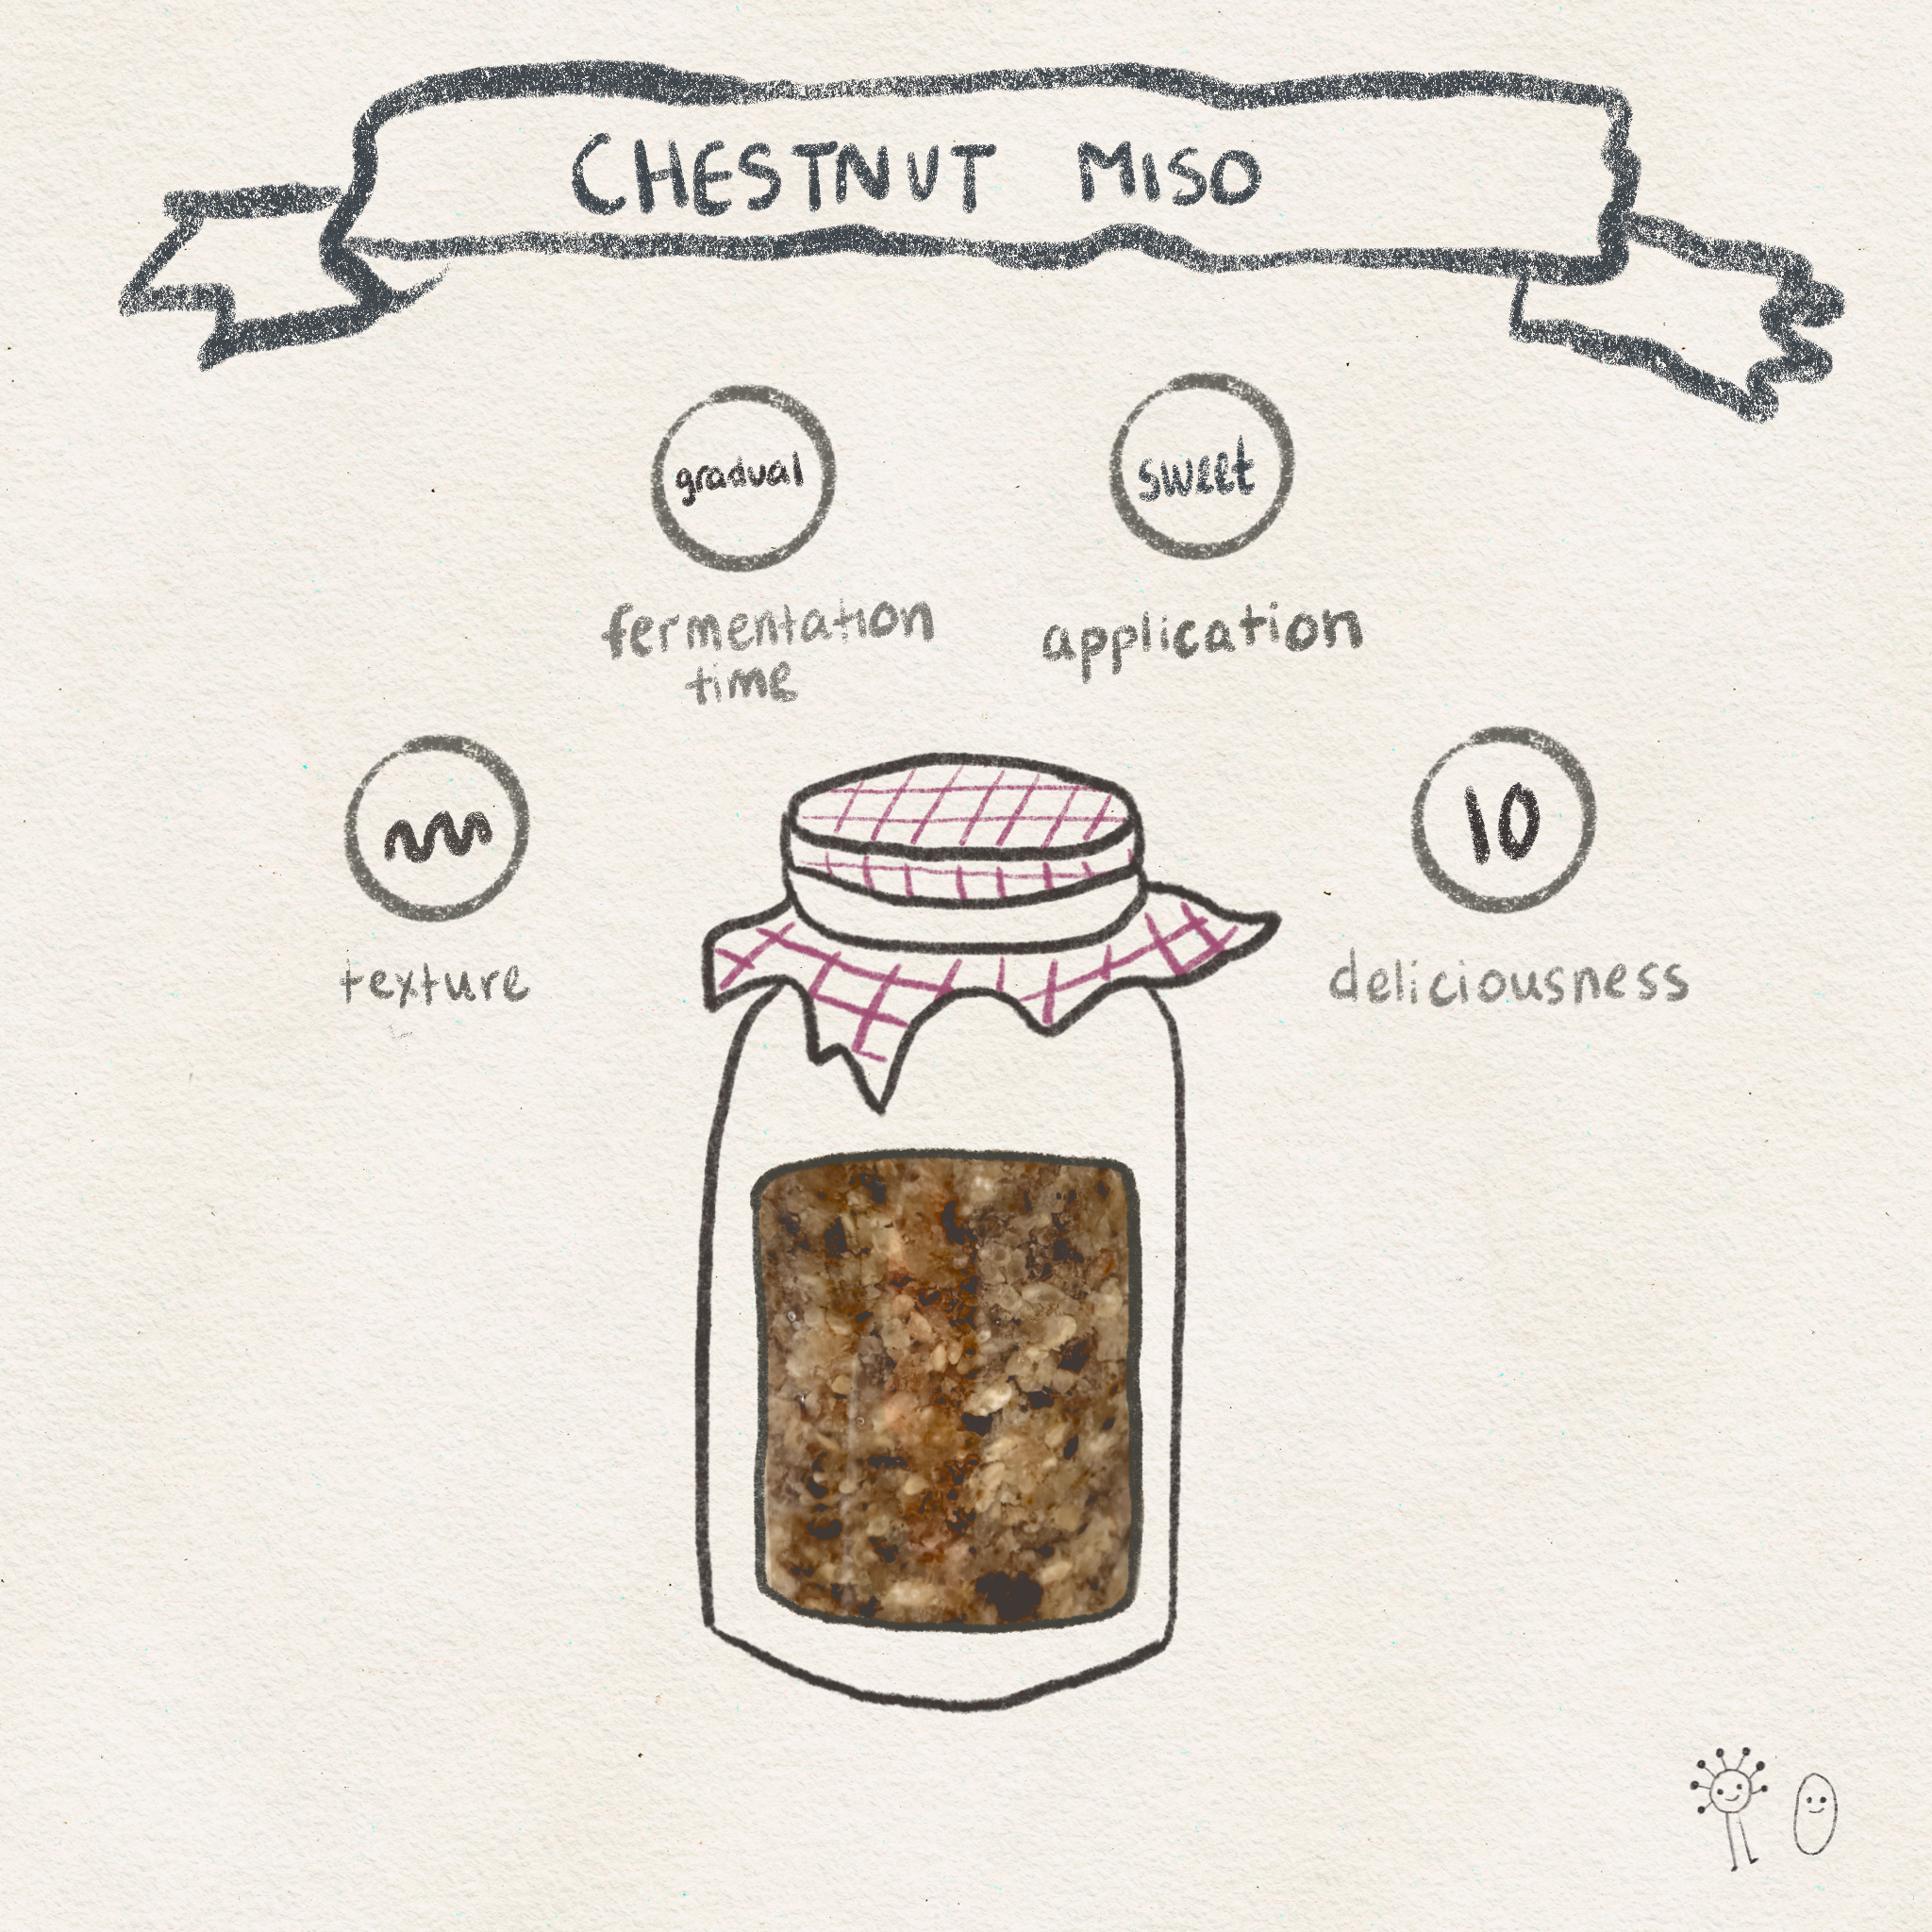
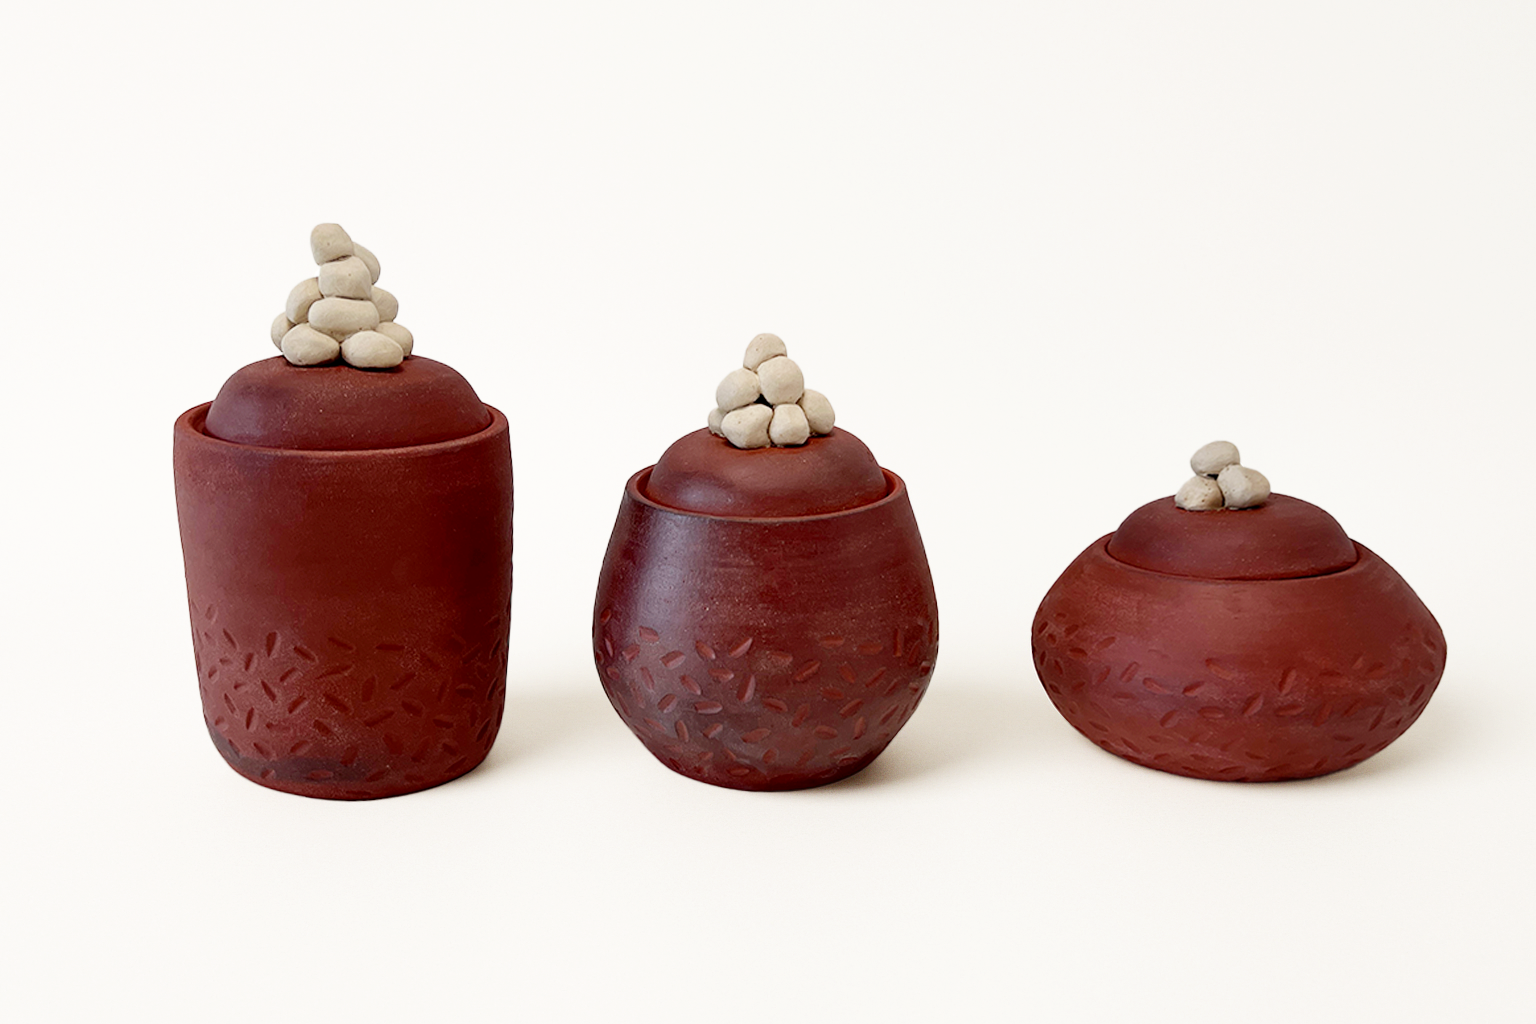
For example, I’ve made ceramic miso jars where texture and form encode fermentation time and ingredient ratios, and I’ve built sonifications that map microbial shifts into melody.
Microbian Symphony https://microbial-symphony.vercel.app/
Wow. That all sounds fascinating!
How would you describe your course? Is this course offering a foundational understanding of the tools used in the field of data visualization or how do you see it?
This course is designed to give you a playful foundation in data visualization. It’s meant for beginners and for seasoned data people who need a reminder that this field can be creative, and meaningful (not just dashboards), and who want to work on a creative side project with data visualization. A lot of folks get into data without ever collecting it themselves. And I think that first-hand experience matters, because it’s where you really learn how bias sneaks in: not just through analysis, but through what you notice, what you ignore, what you define as a “data point,” and what you don’t.
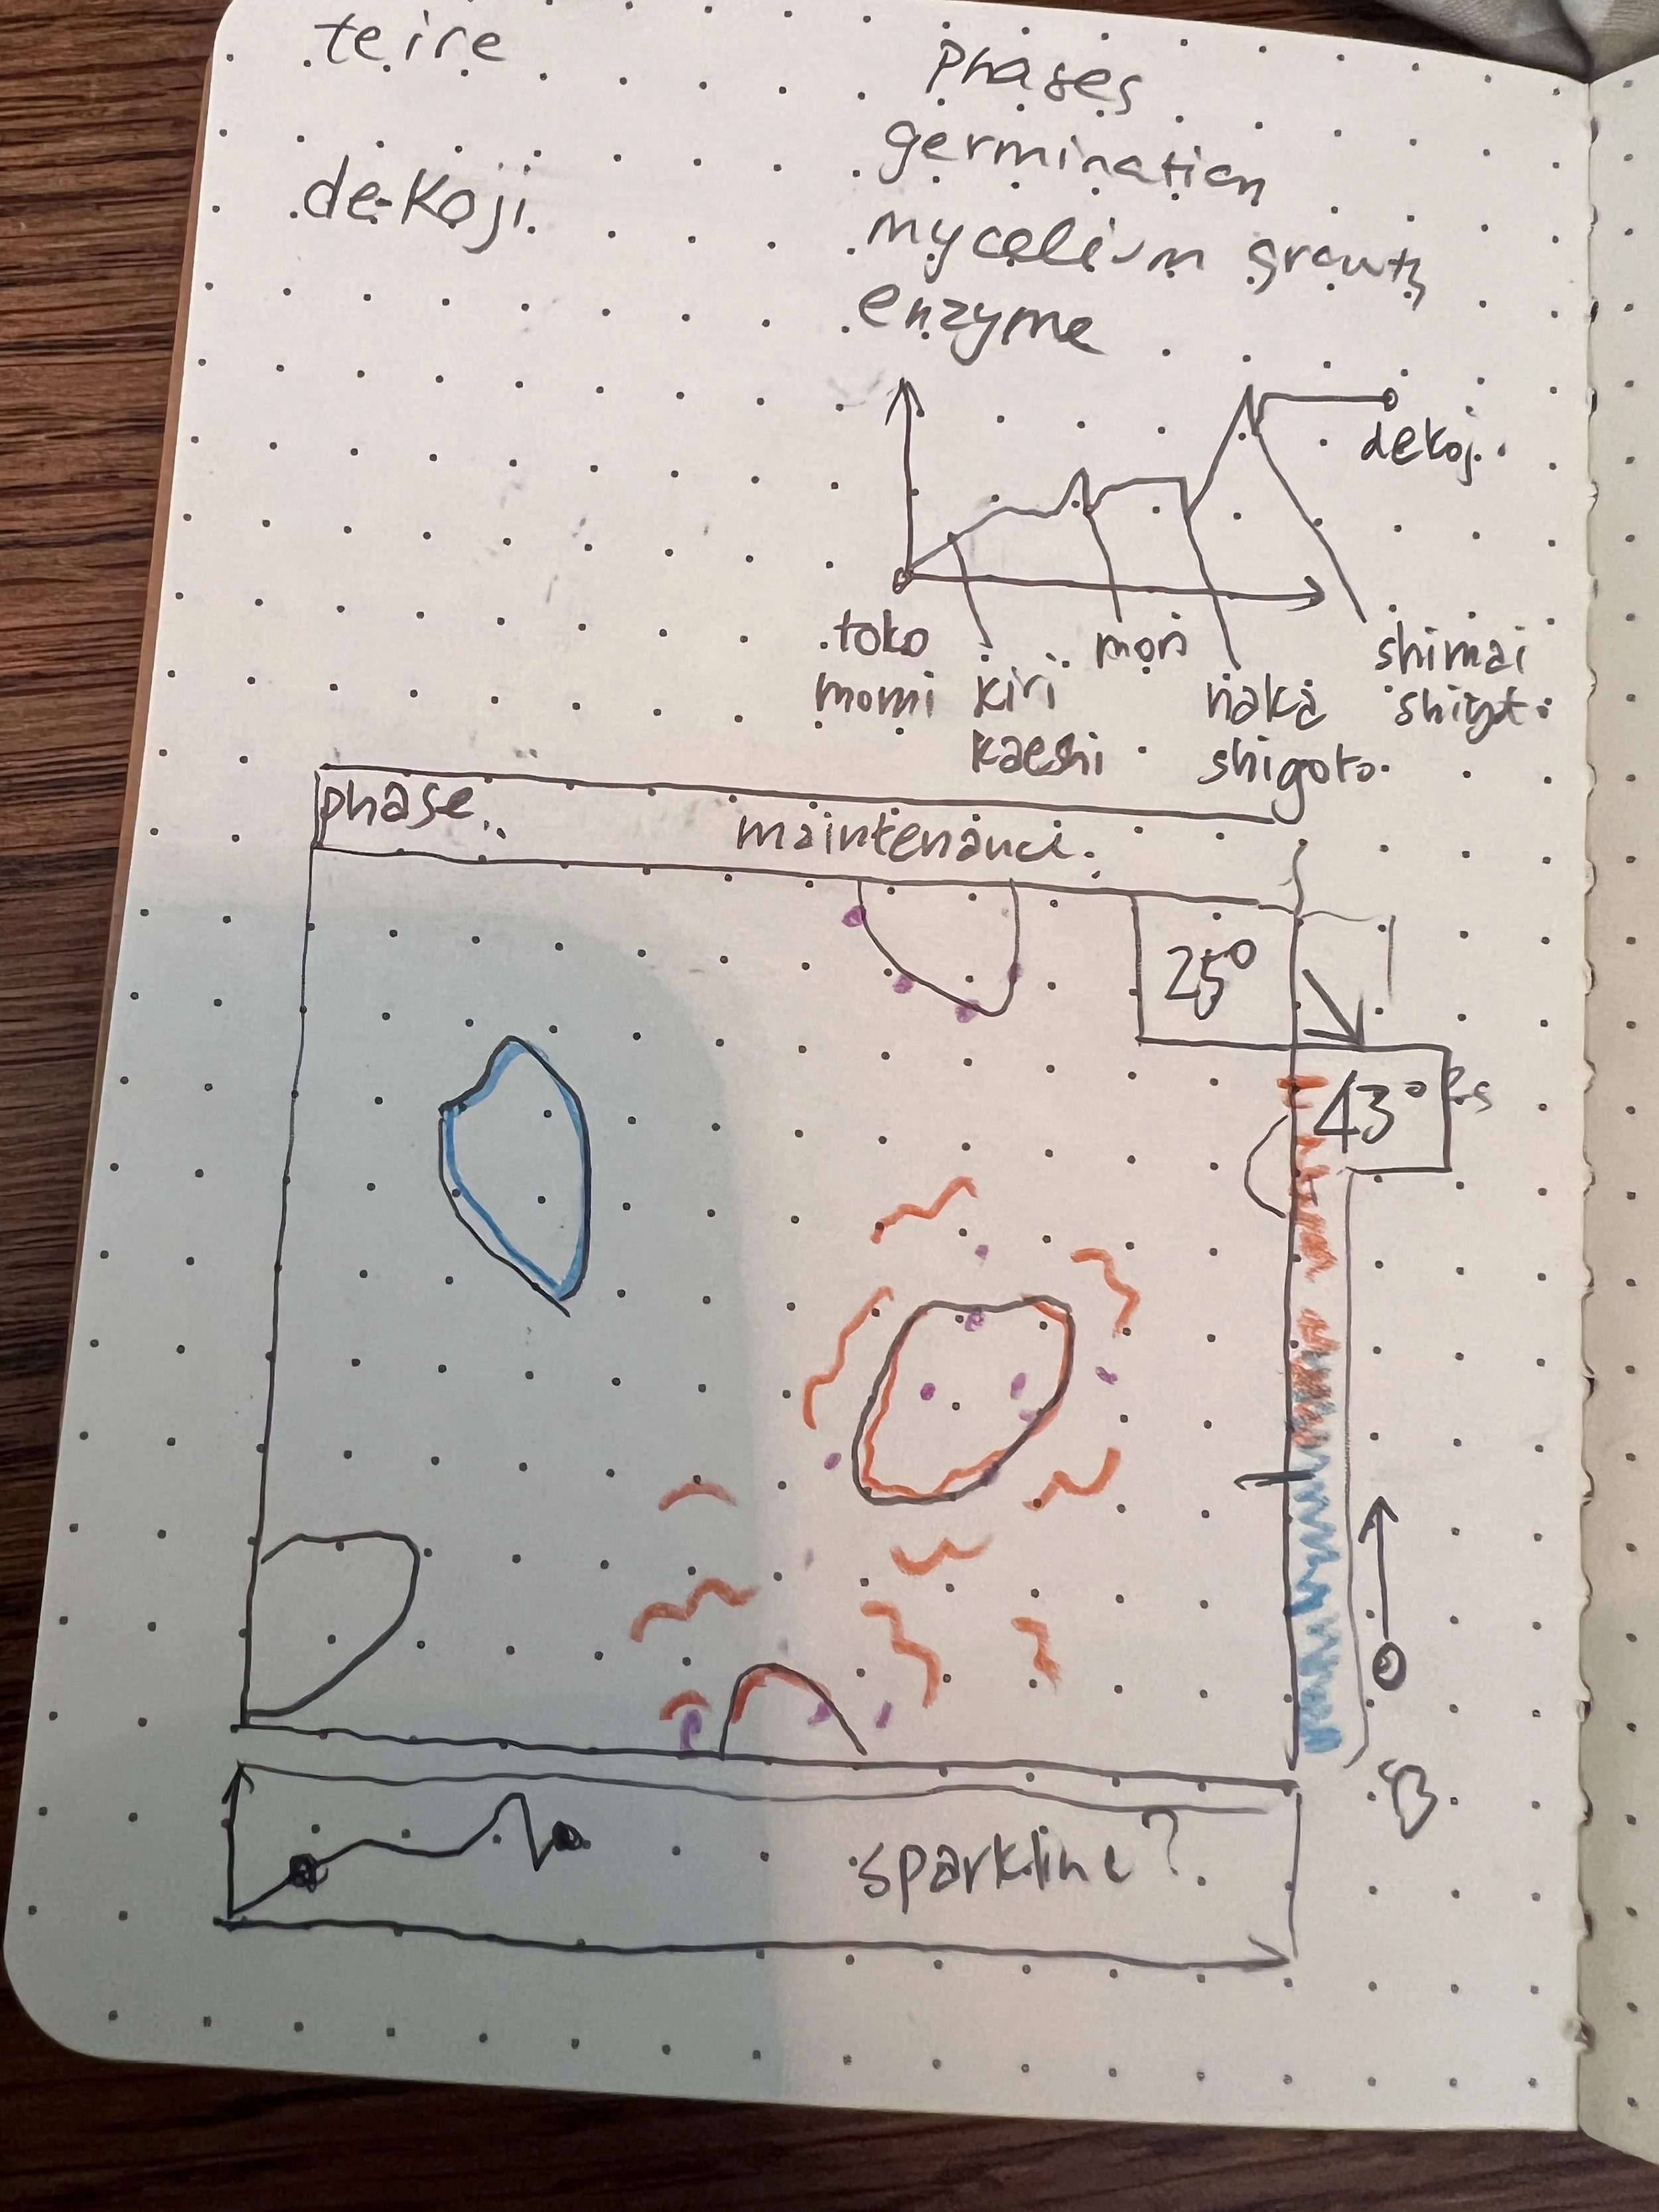
So in this course we’ll treat fermentation like a dataset. We’ll collect observations, turn them into variables, design representations (visual + sensory), and then reflect on what we did to the data. Because every “simple” choice is secretly a story choice.
And because we’re using the senses, sound, touch, smell, taste, we get access to stronger metaphors and more human ways of encoding meaning. That’s useful even if you never make “sensory data” again, because it sharpens how you think about communication and emotional impact.
Why does data matter? Why does documenting the changes in data matter?
Everything is data. So that matters. But it’s also a useful tool for how we notice change and for grabbing attention. Data helps you see patterns you’d otherwise miss. In fermentation, documenting change can mean the difference between “this is developing” and “this is going wrong.”
So documenting changes matters because it gives you leverage over time. You can learn, compare, improve, and tell a more honest story, not just about the outcome, but about the process that produced it.
How did food come into the picture for you? And in this course in particular, why Kimchi?
Food came into the picture because fermentation is a visible change over time. And yes, part of it was a kimchi obsession. But also most people like kimchi, and it’s kind of a level-up from sauerkraut while still being beginner-friendly. It has enough complexity to teach multivariable thinking (ingredients + environment + time) without becoming overwhelming.
And kimchi isn’t just trendy, it’s historically practical, communal, and deeply cultural. Kimchi exists because people needed a way to preserve food through seasons, and in Korea it became a collective act: kimjang, the tradition of making kimchi together. I wanted to bring that to the datasphere, where data collection also becomes a more communal act.
Koji Sonification https://koji-sonification.vercel.app/
What aspect of your practice are you most excited to teach in this course?
What do you want people to take away from their participation?
I’m most excited to teach people how to translate lived experience into variables and encodings, and how to catch themselves in the act of distorting data through “innocent” choices.
I want people to leave with a jar of delicious kimchi they can brag about, obviously. But I also want them to leave with a sharper instinct for questions like: what did we measure, what did we ignore, and what story did that decision force? And ideally, they’ll also leave feeling like data can be playful, human, and a little bit magical!
Anything you’d like to add?
Thanks! :)
Fermenting Data: Kimchee Dataset Edition runs Mondays, 23. February - 23. March 2026, 6-8pm CET
For more info and to join: https://www.schoolofma.org/programs/p/early2026-fermenting-data